Site visits from paid media · 24 months
Monthly visits landed on BIWFD.com from the selected channels, FY2025–FY2026 (Oct–Sep fiscal year)
Site visitsCampaign flight (new brand campaign, Jun 2026)
What this board answers
Three questions the paid media team asks every month — answered from the warehouse, not a spreadsheet
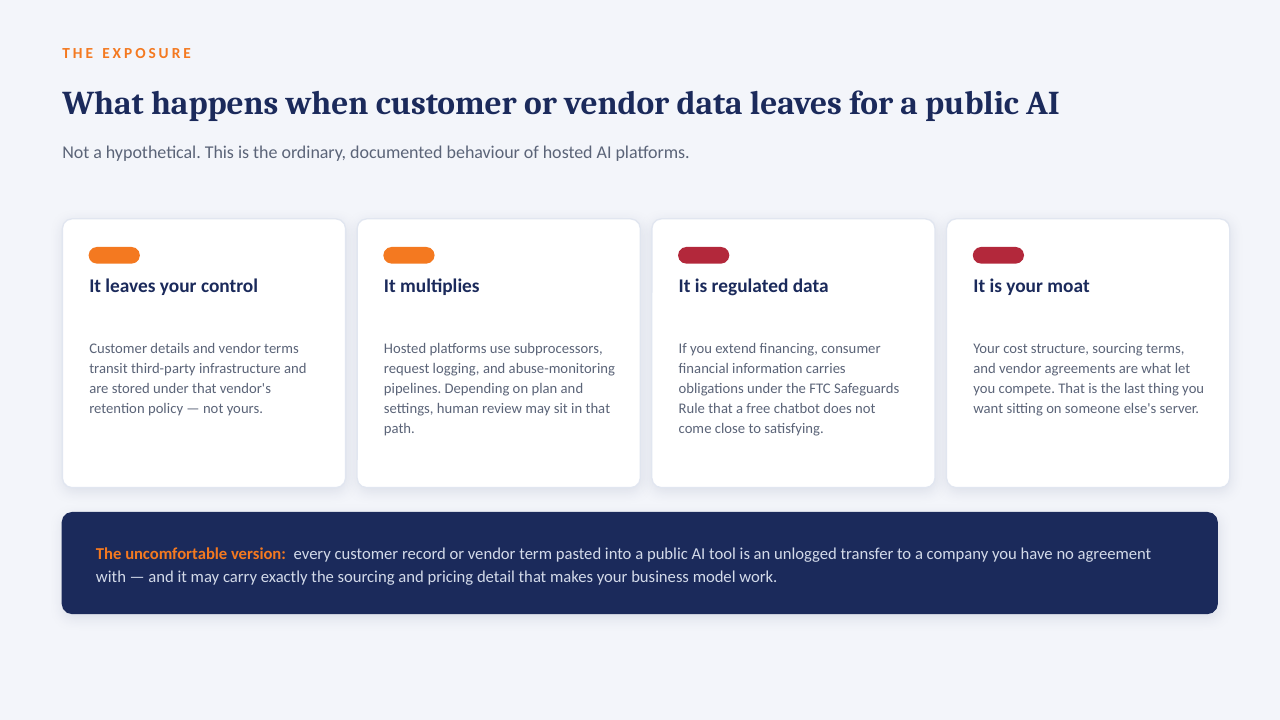
Channel ranking · cost per site visit
Every platform on one cost basis, so The Trade Desk and Google Ads finally sit on the same row
BIWFD.com traffic sources
Where the site's visits come from — anchored to the published FY2025 figures
The connector layer
Every platform → scheduled ingestion → one Azure warehouse → Power BI. Highlighted paths carry the channels selected above; row counts are illustrative daily loads.
Monthly close, automated
The RFP goal in one strip: eliminate manual monthly extraction from disparate advertising platforms
Was
Manual monthly extraction from each platform into Excel.
- Six platform exports, six formats, one analyst
- Trade Desk and Google in the warehouse; Sprinklr, Later and social still by hand
- Metrics defined differently in every tab
- Vulnerable to a broken link, a renamed column, a sick day
Now
Scheduled refresh — the warehouse pulls, Power BI publishes.